Information can be useful--and even beautiful--but only when it’s presented well. In an age of information overload, any guidance through the clutter comes as a welcome relief. That’s one reason for the recent popularity of information graphics. Infographics are visual designs that help to explain complicated data in a simple way (mental-health emergencies at Burning Man, anyone?). But how are they created? What can we learn from the designer’s process? And what does an infographic designer know about storks delivering babies?
Over the last decade, Hyperakt has come to specialize in this type of design, and we’ve found a process that works for us. Here’s how we go about creating an infographic in ten steps:
1. GATHERING DATA
1. GATHERING DATA
Sifting through data is where it all begins. It arrives raw and messy: an excel spreadsheet, some PDFs and links to other resources are typical. While there is sometimes guidance--"We’d like to compare the charts on pages 12 and 65"--we take this as a clue to find the story being told. This is also when we begin to gather additional research from new sources. The full picture of a story is usually found scattered through multiple materials, not in isolated charts alone.
2. READING EVERYTHING
While it’s tempting to read only the highlighted facts and skim the rest, this shortcut tends to result in more time wasted later. Single pieces of information in an ecosystem of research can skew the big picture. Either your client will realize this during the process, or the audience will point it out once the project is complete. Nothing feels worse than working hard on a project, then seeing it picked apart because you didn’t connect the dots. Designers who make infographics are adept at spotting holes in the data, ensuring that no important information has been missed, and making sure the facts support the story being told.
3. FINDING THE NARRATIVE
What starts as boring data will become a boring infographic unless a great story can be found. Infographics start with a unique intent. It might be clarifying a complex set of data, explaining a process, highlighting a trend, or supporting some kind of argument. Finding a great narrative is the first hurdle. Now that the data is familiar, does it seem possible to tell this story with the information at hand? Are you interested in the subject matter? Is this a compelling story worth telling?
4. IDENTIFYING PROBLEMS
As a story emerges from the data at hand, it’s time to stop for a reality check. In many cases, the data doesn’t support the story a client wants to tell. What follows is usually a slightly awkward discussion. Sometimes a client will want the designer to use only the facts that make them look good, twist the data, or otherwise get around this snag. It quickly becomes evident that this pathway is futile for everyone. The data doesn’t lie, and good clients do not want to blatantly mislead. is the next step is a collaborative reworking of the story and the data. Having studied the topic for several days, the designer is a valuable guide to discovering more accurate narratives and presenting them. Pushing back on a client’s original idea can be a frustrating moment. In more subjective situations (color, typography, etc.), it is harder for a designer to win battles, but in these situations the designer’s careful eye for detail is obvious in the data--and often appreciated.
The truth in information takes experience to uncover. Data has a way of winning a debate, whether an argument is true or not. For example, drivers who own red cars are twice as likely to get into accidents than drivers who own blue cars. This truth may (incorrectly) imply that car color somehow causes driving accidents. But the true story is found in a hidden connection, known as the confounding variable. Aggressive personality types are shown to prefer the color red. This aggressive behavior, not car color, is the undisclosed reason that accident rates are affected.
5. CREATING A HIERARCHY
In almost any piece of research, there is a “hero” that leads the story. This piece of data will make your jaw drop. Once you find it, it becomes a way to organize the project and solidifies the hierarchical structure of the infographic. Supporting elements are then arranged to tell the rest of the story. This becomes a kind of mood board of research points. At this stage, the picture of a final product will begin to appear.

6. BUILDING A WIREFRAME
Once the data has been combed, the most interesting facts selected, and a hierarchy determined, a wireframe is created. Here, the designer builds an understandable visual representation of the important information and its hierarchy to send to the client for review. This is not the ultimate design but a tool for discussion, enabling agreement on the structure the final piece will take.
7. CHOOSING A FORMAT
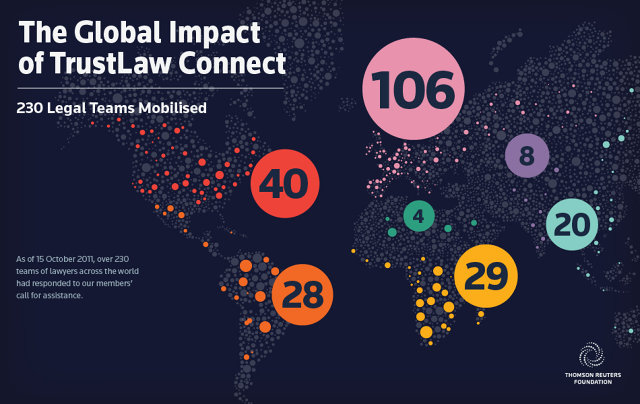
There are endless ways to represent information. The best approach might be with traditional charts and graphs (bar, line, pie charts). It might require a diagram or flowchart to explain a process. A map might be the best way to tell the story. Or perhaps simply showcasing the numbers is best. If the budget is available and the data warrants it, interactivity might make sense and opens a world of possibilities for data visualization. Whatever the case, this decision is guided by the data, which will lend itself to one or a combination of these formats.
8. DETERMINING A VISUAL APPROACH
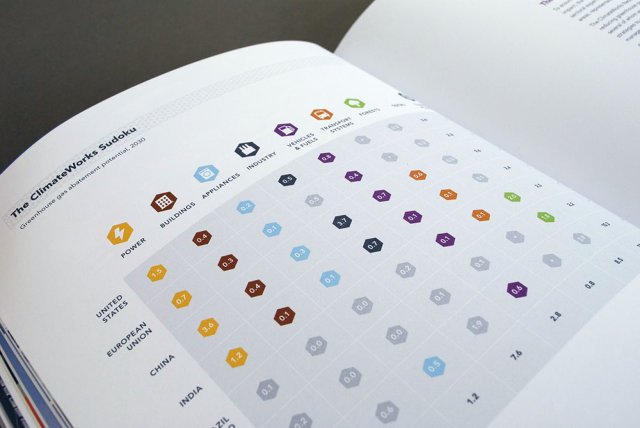
There are two overarching visual approaches to determining the look and feel of an infographic. In one camp, there are those who prefer to make the raw data beautiful (David McCandless, Nicholas Felton, and others subscribe to this view). These often take the form of charts and graphs, made visually exciting by their execution. The use of color, typography, and structure make the piece engaging, like an abstract work of art. Those in the second camp (Peter Orntoft, Scott Stowell), prefer to use illustration or metaphor. Here, the data is disguised, delivered to its audience in a visual narrative often bearing little resemblance to a chart or graph.
At Hyperakt, we are not beholden to any one strategy. Often we create a hybrid: charts and graphs surrounded by more illustrative elements, or a pure visual overlaid with traditional representations of data. The available information, medium, client brand, and subject are what determine an ultimate solution.
9. REFINEMENT AND TESTING
As the infographic takes shape and a visual form, refinements begin. Clients are involved in working through details, both in the data and the visual storytelling, to ensure that the finished product meshes well with their brand and original intent. Internally, we include the entire studio in a testing phase to ensure that the piece is readable and easy to understand, especially to those who have not seen the data before. We evaluate the design and iterate until the piece is as clear and simple as possible. This valuable back and forth between clients and our internal team ends when everyone is comfortable that we’ve delivered the information in the best possible way.
10. RELEASING IT INTO THE WORLD
Most infographics are shared online--even printed illustrations appear online in some fashion. This is the litmus test of your work. Data has the interesting characteristic of being read in many ways by different audiences. All of the fact-checking and expertise imaginable doesn’t mean you’ve discovered every aspect to the story. So even once your piece is published, online discussion can expand (or tear apart) your argument in new ways. This collective vetting often means the project is never quite done. Revisions might happen as new data comes to light. While it is intimidating to let your project become a part of this process, it is also the reason the medium is so rewarding. An intensely scrutinized design is one that has stirred the minds of its audience.
Infographic designers are unusual people. Though budgets rarely account for this involved process, their labor of love continues. Get to know an information designer and prepare to hear some strange facts: Who was the most chillwave band of 2011? Is driving why you’re fat? What are the top five cosmetic procedures in the U.S.? They might even reveal a data geek’s example of causation that explains the storks-and-babies folk tale: The data shows that the more storks in a town, the more newborn babies there will be. But the hidden variable is a town’s land area: the larger the town, the more babies are born there--and, of course, the more habitable area for storks, too.
No comments:
Post a Comment